In my post What is a stepped wedge trial I asserted with some confidence that a stepped wedge trial is a type of randomised controlled trial. But if stepped wedge trials rely so much on clusters acting as “their own controls”, that is comparing outcomes measured after the intervention has been introduced with outcomes at the same cluster before the intervention was introduced, doesn’t this amount to a before-and-after study, which is a decidedly non-randomised research design?
Confounding with time
The major weakness of a before-and-after study is that any improvements you observe could have happened anyway over time: the earlier “control” is not a very good control because it happened earlier. Stepped wedge designs seem to have the same problem: the effect of the intervention is mixed up, or “confounded”, with natural changes that are happening over time.
You can see this easily enough in schematic representations of stepped wedge designs: the later in time you look, the more clusters have crossed over to the intervention – hence measurements of outcome after the intervention has been introduced at a cluster tend to be made later in time. This is almost an inevitable consequence of the one-way cross-over that characterises stepped wedge designs.
This confounding by design of the effects of intervention and time seems to contradict an essential feature of a randomised trial – that there should be no systematic differences between intervention and control participants, other than the intervention itself. So what’s to be done? It will certainly be vital when analysing data from a stepped wedge trial to “adjust” for this confounding before attempting to draw conclusions about the effect of the intervention.
The safest and easiest way to adjust for time is to focus your attention on comparisons of randomised intervention and control participants who are recruited and assessed at the same time as each other – in fact this is essential to conducting a randomised controlled trial. I’m going to illustrate two fundamentally different ways of doing this in a stepped wedge design.
Between-cluster and within-cluster comparisons
Suppose clusters are randomised to one of five possible sequences as shown in the diagram below, with data collected over six time periods and the sequences forming a “classic” stepped wedge scheme, all starting in the routine care or control condition, and all finishing in the intervention condition. Let’s suppose that the intervention in this example is intended to increase scores on a quality of life scale.
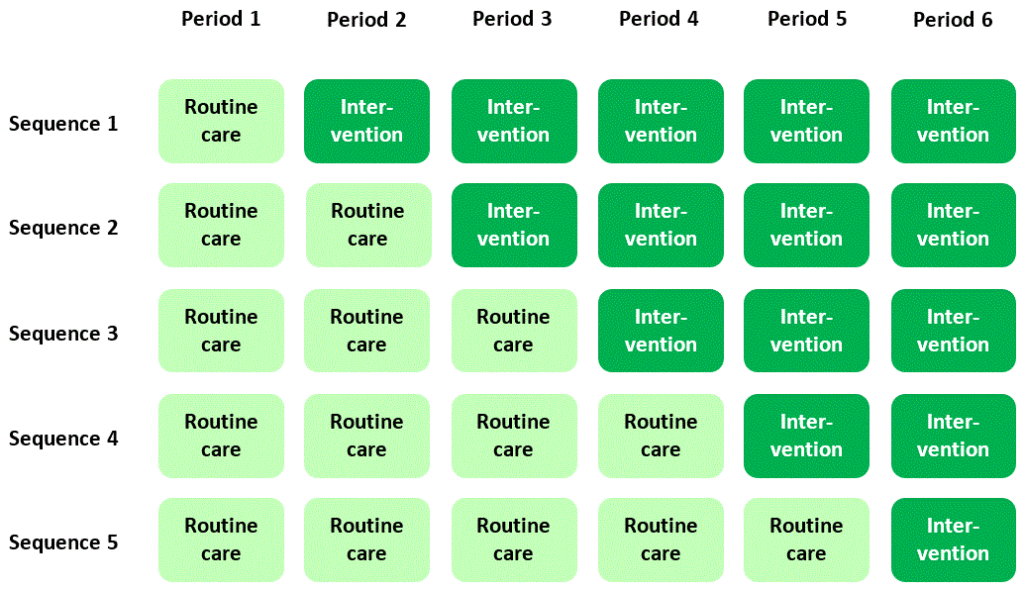
(Some important notes: As I said in What is a stepped wedge trial, you shouldn’t imagine that this is the only way to lay out a stepped wedge trial, but it’s convenient as an example. I am assuming that clusters are randomised to sequences – if they’re not, it’s just an observational study. To understand what it means to collect data in different “periods”, see Three kinds of stepped wedge trial.)
Now, let’s focus, purely for illustration, on two cells of the diagram where data are collected from randomised intervention (sequence 1) and control (sequence 3) clusters with participants recruited and assessed at the same time as each other (period 2):
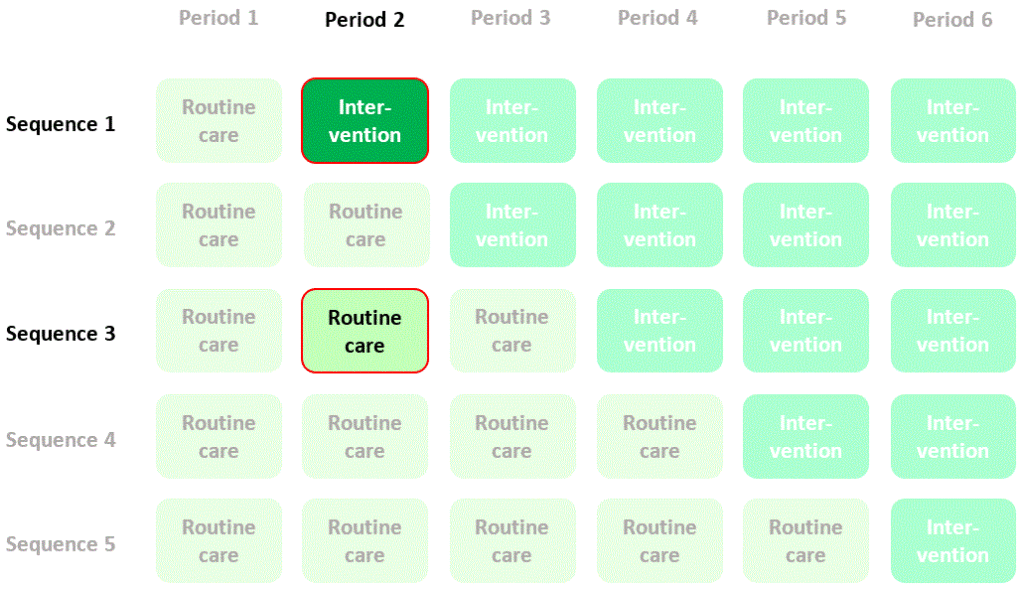
We could estimate the effect of the intervention by calculating mean quality of life in period 2, sequence 1 (intervention) and subtracting mean quality of life in period 2, sequence 3 (control). I’ll refer to this as a “between-cluster” estimate of the intervention effect. The contribution of quality of life measurements in the two cells of the diagram to this estimate of the intervention effect is summarised thus:
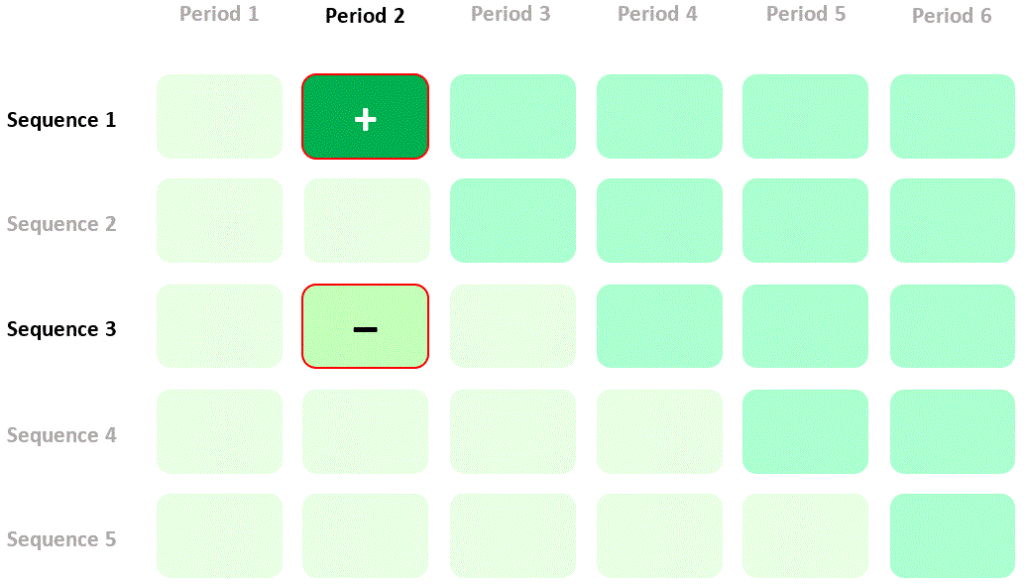
So far, so good. But now let’s try something else. Let’s compare outcomes assessed in the same clusters (specifically in sequence 2) in two different time periods (period 2 and period 3) – that is, let’s try using clusters as their own controls:
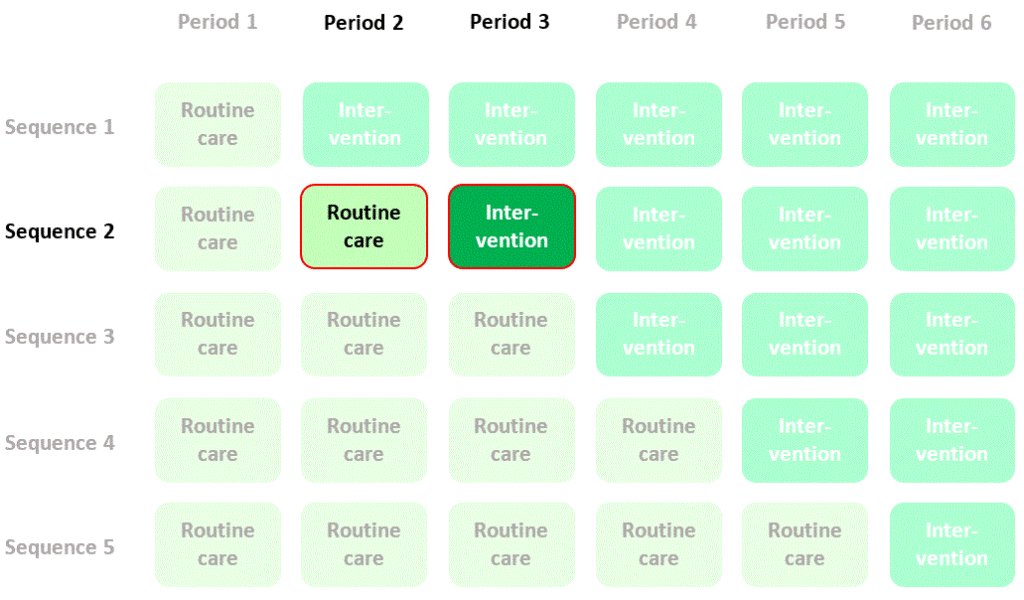
We could estimate the effect of the intervention by calculating mean quality of life in period 3, sequence 2 (intervention) and subtracting mean quality of life in period 2, sequence 2 (control), but the problem with this estimate is that the change in quality of life might just be a change that occurred naturally over time. To allow for this this we need to compare this change in quality of life with the contemporaneous change seen in another randomised sequence that doesn’t cross over to the intervention (e.g. sequence 3):
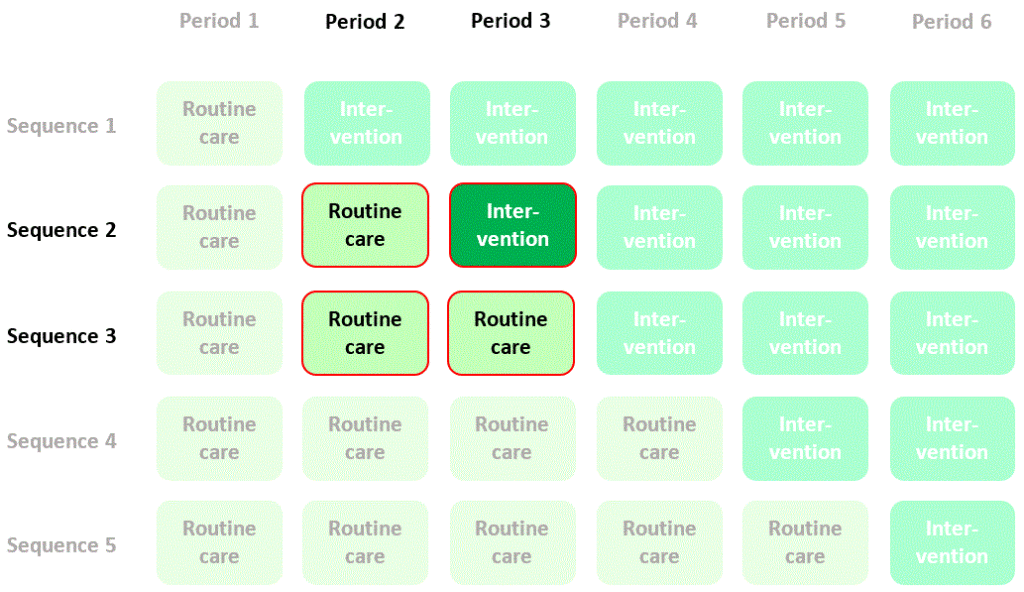
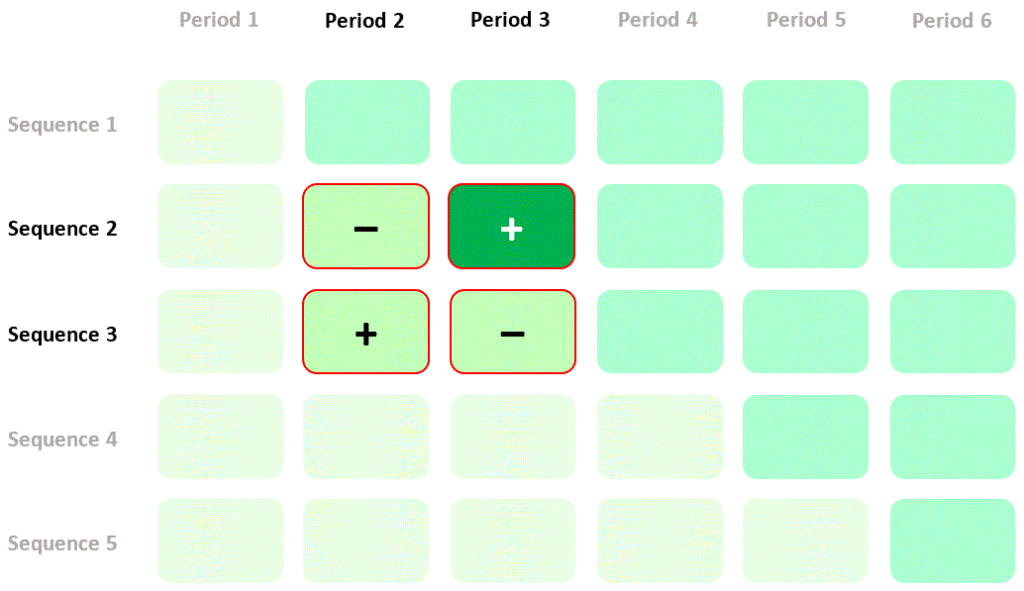
If we calculate the difference between the differences in mean quality of life in the two sequences (the “difference in differences”) then we have a new estimate of the intervention effect based on a randomised comparison. I’ll refer to this as a “within-cluster” estimate of the intervention effect. The contribution of quality of life measurements in the four cells of the diagram to this estimate of the intervention effect is summarised thus:
Combining between- and within-cluster comparisons
Now, I hope to persuade you that something very odd is happening in the previous diagrams. Quality of life in period 2, sequence 3 contributes positively to the particular within-cluster estimate of the intervention effect I described above, but contributes negatively to the particular between-cluster estimate I showed you earlier (go back and check the diagram). So, if I’m using the within-cluster estimate then better quality of life in period 2, sequence 3 will lead me to think that the intervention is more effective, but if I’m using the between-cluster estimate then better quality of life in period 2, sequence 3 will lead me to think that the intervention is less effective. How can the same data make me think opposite things? Which of my two estimates is valid?
Curiously, both are valid. They just give is different ways of estimating the same intervention effect. While you’re wondering which to use, consider also that there are many other ways I could have picked a pair of cells for a between-cluster estimate, and many other ways I could have picked four cells to construct a within-cluster estimate. It seems there might be any number of ways that I could combine, or choose among all of these different between- or within-cluster estimates to produce a valid, overall estimate of the intervention effect that was based on randomised comparisons, using all of the data from the stepped wedge trial.
Analysis methods
And here’s the good news: you don’t even have to worry about exactly how to do this. If you use the most common approach to analysing data from a stepped wedge trial – a multi-level model, using mixed regression or generalised estimating equations – then the analysis itself does all of the work (internally, so you don’t see it happening) of combining different between- and within-cluster estimates in the most efficient way – which is to say, squeezing the most information about the treatment effect out of the available data. Magic.
Efficient estimation of the intervention effect does not always draw heavily on the within-cluster comparisons, which is why, in the example discussed in Reasons for doing a stepped wedge trial, the optimal design mainly involved clusters remaining in the same condition (intervention or control) for the duration of the trial. There are alternatives to multi-level modelling for data analysis that deliberately focus on between-cluster comparisons even when this is less efficient, because it requires fewer modelling assumptions. Some references on different approaches to data analysis are provided on the Resources for Researchers page.
The bottom line
So, in conclusion, don’t believe anyone who tells you that a stepped wedge trial is not a bona fide randomised controlled trial, or that the intervention effect is irretrievably confounded with time. A stepped wedge trial is a randomised controlled trial, albeit a rather complicated one.

However, while randomisation is a powerful tool (see What is a randomised controlled trial) randomised trials can still be subject to biases, and stepped wedge trials may suffer particularly badly. Because of their extended timescale stepped wedge trials may have to recruit individual participants after the clusters have been randomised, making allocation concealment more difficult, for example. Remember that the best studies are not always trials, and the best trials are not always stepped wedge trials.

Very interesting Richard. When there are few clusters it seems to ask an awful lot of randomisation for valid inference , even if the power calculations reassure us that we have enough power. Always important to keep practicalities in mind when deciding on different designs
Yes, interesting point. Randomisation must still be valid in some important sense however many clusters there are, but realistically with a small number of clusters it’s more likely that we might observe clear, post-hoc differences between the clusters randomised to different groups or sequences, and having observed that, how can we ignore it in drawing a conclusion? In this post it’s the number of sequences that is small rather than the number of clusters, necessarily, but in practice being limited to a small number of clusters is an issue in cluster randomised trials of all kinds – not just stepped wedge.