

Suppose you hear about a randomised controlled trial of treatments for patients with acute coronary syndrome (an umbrella term for conditions involving sudden, reduced blood flow to the heart), involving tens of thousands of people, and making use of high-quality registry data (something a bit like the SWITCH-SWEDEHEART trial,[1] for example). This study concludes that treating patients with drug A leads to substantially fewer deaths, strokes and heart attacks than treating with drug B. To heck with it: suppose, with a bit of digging, you find two more randomised controlled trials with similar design and sample size, each concluding the same thing as the first, all with consistent estimates of the numerical reduction in deaths, strokes and heart attacks. You’d be pretty impressed with this, wouldn’t you?
But what if someone pointed out to you that all the trials were stepped wedge trials (like the SWITCH-SWEDEHEART trial), and that each of them randomised only a small number of clusters – perhaps fewer than five? Should we think of the sample size of each trial as being in the tens of thousands, or fewer than five? If we came across an individually randomised trial that randomised fewer than five individuals, would we give it the time of day?
In an earlier post, I took pains to defend the idea that stepped wedge trials are true randomised controlled trials. But one issue I have neatly sidestepped in all my earlier posts is the problem of small numbers of clusters. It is time to speak of it now. It is a problem that cannot be ignored: reviews suggest that around half of all published stepped wedge trials have ten or fewer clusters. When weighing up the evidence for the effectiveness of an intervention, how concerned should we be to discover that some or all of this body of evidence comes from stepped wedge trials?
One approach to rating the certainty of evidence from a body of research is called GRADE.[2] GRADE starts by assuming that evidence from randomised studies has high certainty, while evidence from non-randomised (“observational”) studies has low certainty. But this is not quite the rigid pyramid of evidence I talked about in my post “What is a randomised controlled trial“. With GRADE, users may “rate down” the certainty of evidence from trials if they identify limitations in any one of five domains: imprecision, inconsistency, risk of bias, indirectness and publication bias. (They may also rate up the evidence from observational studies based on other considerations.)
I’m going to focus in this post on two of these GRADE domains: risk of bias and imprecision. Both may be applied at the level of an individual study making up a body of evidence. Precision relates to how far we can narrow down the effect of the intervention of interest. Bias refers to systematic error. Recall that one of the motivations for randomising is to try to eliminate systematic differences between the two arms of a trial. But not every trial successfully eliminates bias, and some may end up being “down-rated” under the GRADE framework.
To think more deeply about randomised trials, I want to start by reducing them to the absurd.
When a randomised study is no better than a non-randomised one
In an earlier post I explained how stepped wedge trials are cluster-randomised trials carried out over an extended time interval, during which clusters may cross over from routine care to the intervention.
Let’s consider a trial with just two clusters, which are randomised to two different sequences, in the following plan:
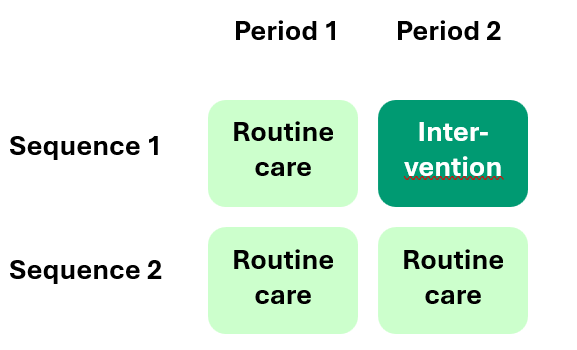
Remember, I’m trying to reduce the study design to something primitive or even absurd. The design above isn’t something we would naturally think of as a stepped wedge design, necessarily, but hopefully you can see a family resemblance between it and the “classic” plan illustrated in my post “What is a stepped wedge trial?”. More interestingly, the above design is a common design for a randomised trial, though not when it features just two clusters.
Suppose our clusters are hospitals. Let’s randomise our two hospitals to the two sequences: one hospital (chosen with a coin-toss) we allocate to sequence 1, the other to sequence 2. What do we think of this as a research design? Can we think of it as a randomised controlled trial? We won’t need to look very hard to find differences between the two hospitals, and the existence of such differences will erode our confidence that observed differences in health outcomes are due to the intervention.
A related problem becomes apparent if we open our favourite statistical analysis software package, and ask it to analyse the data from our “trial”: the computer will say “no”, and fall over. The reason is that the usual analysis of trial data relies on benchmarking the differences that we can see between groups against differences that exist within groups. With just one hospital per sequence there is simply no variation (in hospitals) that we can observe within either sequence.
So, is our study completely useless? Actually, no! What if we looked at how much outcomes had changed from Period 1 to Period 2, for patients attending the hospital allocated to the first Sequence 1? There could always have been some improvements happening naturally over time, of course, which had nothing to do with the intervention, but we could get a handle on these natural improvements over time by looking at how much outcomes changed from Period 1 to Period 2 in patients attending the hospital allocated to Sequence 2. This gives us a kind of “control” for the change in Sequence 1. By working out the difference between these two changes, we end up with a quantitative estimate of the change in health outcome that we might attribute to the intervention. This is called a “difference in differences”.
Observational studies are designed like this (and analysed like this, using difference in differences) all the time. One hospital implements the intervention and we measure the change; another hospital continues to deliver routine care, and acts as our control. What this does not do is to eliminate bias: our “randomised trial” of two randomised clusters is no better than an observational study, and we must acknowledge the risk of bias inherent in it.
The above example, absurd though it is, establishes that it is possible for a stepped wedge trial to be so small (in terms of the number of clusters) that we cease to think of it as a trial at all. Perhaps, by extension of this idea, we should consider “down-rating” the evidence from any cluster randomised trial that has a “small” number of clusters, in some sense. But how small is “small”?
Suppose, now, that we have just four clusters, randomised to the same two sequences as before, and making sure, at least, that two clusters are allocated to each sequence. This still sounds very few, but (rather miraculously) this time we can put the data through our statistical analysis software package and get a sensible-looking answer. (With even more of an extraordinary flourish, and if we ensured that we started with one urban teaching hospital, one rural teaching hospital, one urban district general hospital, and one rural district general hospital, we could estimate the effect of the intervention adjusted for effects of urban vs rural, and teaching hospital vs DGH!) But do we really believe that by randomising our four clusters we have achieved that serene state of low-risk-of-bias, which randomisation commonly brings? Most people would not assume, with just two hospitals in each sequence, that we had washed away this risk. After all, how would we view an individually randomised “trial” that only had four participants in it?
And so, I pose the question again: what number is too “small”? Our problem, it turns out, has to do with permutations.
How permutations help us distinguish randomised groups
Let’s forget clusters and extended time periods for the moment, and go back to individually randomised trials. Suppose you’re running a trial of an intervention to reduce systolic blood pressure. There are just four participants, randomised so that two receive the intervention, and two the control. Suppose that at follow-up, the intervention participants have systolic blood pressure measurements of 117mmHG and 116mmHG, and the control participants have systolic blood pressure measurements of 133mmHg and 134mmHg. Is this evidence that that the pattern of SBP measurements we would expect to see in patients who receive the intervention is fundamentally shifted downwards, compared with the pattern of SBP measurements we would expect to see in control patients?
What if, in truth, there were no effect of the intervention at all. Then the four SBP measurements we have observed – 116, 117, 133, 134 – must reflect the pattern of SBP measurements we would expect to see more generally across the population of patients, under either the intervention or the control. Now suppose I had allocated the same four patients to intervention and control in a different pattern (but still two patients to each). If there was, in truth, no effect of the intervention, I would still observe SBP measurements of 116, 117, 133, 134, but allocated to the two groups in different ways. Is it so striking that what I actually saw was a split of 116,117 in one group, and 133, 134 in the other? There are only six possible ways this might have ended up differently – six different ways of randomising four patients to intervention and control, with two in each. On this basis, I’m not convinced that the observed result is so special.
This idea – of thinking about what would happen if (hypothetically) we were to re-randomise participants in different ways – is the basis of a distribution-free approach to hypothesis testing called a permutation test. The number of possible ways of re-randomising – the number of permutations – determines how fine-grained a p-value we can obtain from a permutation test – that is, how coarsely or finely we might interpret the evidence for an effect of the intervention. The finer the better, naturally. Of course, p-values are not everyone’s cup of tea, but the coarseness of the possible permutations represents a much more fundamental, more generalisable challenge to inference.
Perhaps this helps us to understand, and indeed to quantify, when a randomised trial might be too small to be thought of as a randomised trial. Suppose we demand that there should be a “large” number of different ways of randomising participants (or clusters in a cluster-randomised trial). OK – I’m still dodging the question of how large “large” should be, but what if we put a figure on this as a way of constructing a simple rule for down-rating evidence from stepped wedge trials. What if we down-rate evidence on the risk-of-bias domain whenever there are fewer than, say, 100 permutations?
To give you a feel for what this means in practice, a stepped wedge trial with four clusters allocated to four sequences would be down-rated on this basis, but a stepped wedge trial with five clusters allocated to five sequences would not. Having a black-and-white cut-off will always be slightly arbitrary, of course.
Next, I want to consider the analysis. Can we estimate the effect of the intervention if we don’t trust the randomisation?
Fixed effects analyses of stepped wedge trials
Recall how, in the example of a randomised trial with just two clusters, the analysis we were led to was a difference in differences. The difference in differences turns out to be a simple example of something more general, called a “fixed effects” analysis.[3] A fixed effects analysis does not rely on concurrent comparisons of clusters in control and intervention conditions, but instead compares control and intervention within clusters, in a way that also adjusts for possible changes over time. Fixed effects analyses are not fazed by systematic differences between clusters, but also forego all the benefits of randomisation. They ignore the randomisation, or at least they don’t rely on it.
So, a possible rule for analysis (or equally for down-rating on risk-of-bias) might be: if the number of clusters is so small as to result in fewer than 100 permutations, say, then we should down-rate (if we are rating the evidence), and we should use a fixed effects analysis (if we are analysing the data).
And for stepped wedge trials with larger numbers of clusters, and more permutations? Most statisiticans would use mixed regression or generalised estimating equations.[4] “Mixed” refers to a mixture of “fixed” and “random” effects, and I’m simply going to refer to this as a random effects analysis: the counterpoint to a fixed effects analysis.
My suggestion is to use fixed effects for small numbers of clusters, and random effects for large numbers. Some people have suggested that fixed effects and mixed regression analyses target fundamentally different research questions, but I’m not convinced by this – I think it is perfectly possible to view them as different analysis choices.
Incidentally, there is still more work to be done to understand how fixed effects analyses can be done in a way that is completely robust to the different kinds of clustering of individual-participant-level data seen in stepped wedge trials, but I will gloss over this, for now.
So, has this solved the problem of small numbers of clusters in stepped wedge trials? We’ve only just begun.
Imbalanced cluster characteristics
One thing people often assume about randomising clusters is that it will naturally balance characteristics of those clusters. In truth, a finite number of randomisations can never achieve perfect balance on every possible characteristic. But suppose we had identified two or three key characteristics that we thought could influence outcome: urban vs rural hospitals, or teaching hospitals vs district general hospitals, for example. If we randomise very large numbers of hospitals, we should see that these characteristics are fairly well balanced. But if we randomise very small numbers of hospitals, they will probably not be.
If we read the results of a cluster randomised trial where we can see that the randomisation has not achieved a balance in some measured cluster characteristic that we think is important, and if the published analysis does not adjust for this imbalance, then this analysis is at risk of bias, and we must down-rate the evidence from that trial accordingly.
Trial investigators can fix this problem by adjusting their analyses, but in addition may be well-advised to randomise in a way that ensures balance.[5] This balance-by-design will improve the efficiency of their adjusted analysis, and avoid the risk that allocation to intervention vs control might end up completely confounded with some important characteristic of clusters. But beware: balance-by-design will also reduce the number of possible permutations of the randomisation!
If we find ourselves resorting to a fixed effects analysis, then we lose the benefits of randomisation, and the evidence is down-rated accordingly, but at least we need not worry further about any imbalance in cluster characteristics: a fixed effects analysis effectively adjusts for all observed and unobserved differences between the clusters.
Small-sample corrections to random effects analyses
Random effects analyses and generalised estimating equations rely on large-sample approximations, and it is well known to statisticians that they may over-estimate the precision of the intervention effect. This problem gets worse when there are fewer clusters. Luckily, there are “small-sample corrections” to the analysis that we can apply to correct the problem.
How small does the number of clusters in a cluster-randomised trial have to be before we need to apply a small-sample correction? Many commentators suggest something in the region of 30 or 40. This, by the way, includes the vast majority of published stepped wedge trials.
Realistically, then, researchers should routinely be applying small-sample corrections whenever they analyse a stepped wedge trial. If we read the results of a stepped wedge trial that does not apply a small-sample correction, then we should suspect the published precision is over-optimistic, and we should down-grade the evidence further – this time on the basis of precision, rather than risk of bias.
But there’s another problem. When the number of clusters becomes very small, small-sample corrections stop working as intended. They just cannot cope with this level of reduction (like when Ant-Man becomes so small that he enters the Quantum Realm). The consequence is that the corrections become too conservative: they tend to under-estimate the precision of the intervention effect, but not in a way that is easy to self-correct. The evidence doesn’t need down-rating, but it’s bad news for the investigators.
Again, a fixed effects analysis should solve this problem. Resarch suggests we should start to be concerned about the performance of random effects analyses with small-sample corrections when the number of clusters in a cluster-randomised trial is of the order of six to ten. Perhaps our number-of-permutations rule for switching to a fixed effects analysis can be made to align with this issue too.
Conclusions
There seem to be plenty of reasons why we may want to down-rate evidence obtained from stepped wedge trials with small numbers of clusters, and this post has not even touched on other issues that might lead to down-rating, such as the risk of bias when participants in a stepped wedge trial are identified after clusters have been randomised.[6] Small numbers of clusters create a variety of challenges.[7]
We can mitigate some of the “quantum-realm” challenges of stepped wedge trials with small numbers of clusters, at the analysis stage at least, using fixed effects analyses, but in doing so we acknowledge that we have lost the power of randomisation.
So, are stepped wedge trials a complete waste of time? Should we despair to see new registrations for stepped wedge trials doubling every five years? No! They are instances of an incredibly powerful and efficient design. But let’s not apply this technology either badly or indiscriminately. Let’s focus on finding ways to do stepped wedge trials on ever larger numbers of clusters, and on eliminating selection biases, for example leveraging large electronic databases like OpenSAFELY.
This website believes in stepped wedge trials.
References
1. Omerovic E, Erlinge D, Koul S, et al. Rationale and design of SWITCH-SWEDEHEART: A registry-based, stepped-wedge, cluster-randomized, open-label multicenter trial to compare prasugrel and ticagrelor for treatment of patients with acute coronary syndrome. Am Heart J 2022;251:70-77
2. Guyatt G, Agoritsas T, Brignardello-Petersen R, et al. Core GRADE 1: overview of the Core GRADE approach. BMJ 2025;389:e081903
3. Matthews JNS, Forbes AB. Stepped wedge designs: insights from a design of experiments perspective. Stat Med 2017;36:3772–3790
4. Hemming K, Haines TP, Chilton PJ, Girling AJ, Lilford RJ. The stepped wedge cluster randomised trial: rationale, design, analysis, and reporting. BMJ 2015;350:h391
5. Nevins P, Davis-Plourde K, Pereira Macedo JA, et al. A scoping review described diversity in methods of randomization and reporting of baseline balance in stepped-wedge cluster randomized trials. J Clin Epidemiol 2023;157:134-145
6. Eldridge S, Campbell MJ, Campbell MK, et al. Revised Cochrane risk of bias tool for randomized trials (RoB 2): additional considerations for cluster-randomized trials (RoB 2 CRT). Available from https://www.riskofbias.info/welcome/rob-2-0-tool/rob-2-for-cluster-randomized-trials
7. Quintin O, Kasza J, Davies N, Markham S, Hooper R. Small numbers of clusters in cluster-randomized trials: a scoping review of problems and proposed solutions. J Clin Epidemiol 2026;198:112395